WaveColor is a free studio tools VST plugin developed by Mirax Labs. Compatible OS(s): Windows.
SEE your music like never before in the color-coded waveform with a dynamic brightness.
http://miraxlabs.com/
Free Audio Plugins & Softwares. All the Best VST & Audio Units Available for Free.

SEE your music like never before in the color-coded waveform with a dynamic brightness.
http://miraxlabs.com/
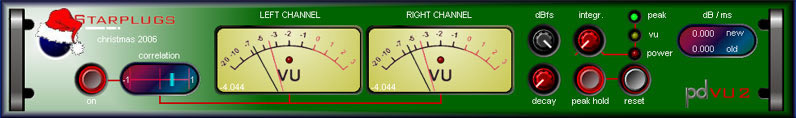
VU2 is a 2 channel high precision meter. It can be used as Peak meter, Program Peak meter, VU meter or Power meter with integration times from 1 sample to 1 second and decay times from 1 sample to 10 seconds. The meter headroom can be adjusted in 0.1 dB steps from 0 to –20 dBfs. Each VU meter comes with an over-hold LED and features a second peak-hold needle. The VU2 also features a correlation meter.
Features:
- Peak Meter.
- Program Peak Meter.
- VU Meter.
- Power Meter.
- Correlation meter.
- Over LED.
- Peak Needle.
- PDF Manual.

http://www.starplugs.com/
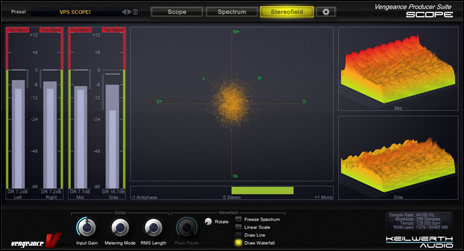
VPS Scope is an analyser plugin with scope, spectral and stereo analysis:
- supports different VU metering modes.
- synced & free running, zoomable realtime waveform.
- fft analyzer (line, bar, band size configurable).
- rotatable 3d spectral display.
- stereo vector-scope, Correlation, M/S modes.
- many options and configurations.
- available in VST, VST3, AAX and AU format.
This plugin is free for all customers. This means you need to have at least 1 Vengeance license key on your dongle to use it. Which one does not matter.
{See video at top of page}
http://www.vengeance-sound.com/
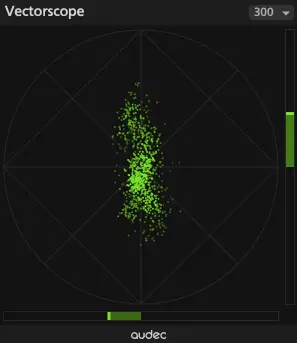
Features:
- Vectorscope.
- Correlation Meter (Right).
- L/R Balance Meter (Bottom).
- Resizable window.
Price: Free.
http://audec-music.com/
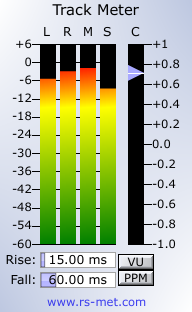
Track Meter is a plugin to display the current level of a stereo input signal separately for the left, right, mid and side channels and also to display the cross-correlation between the two channels.
http://www.rs-met.com/
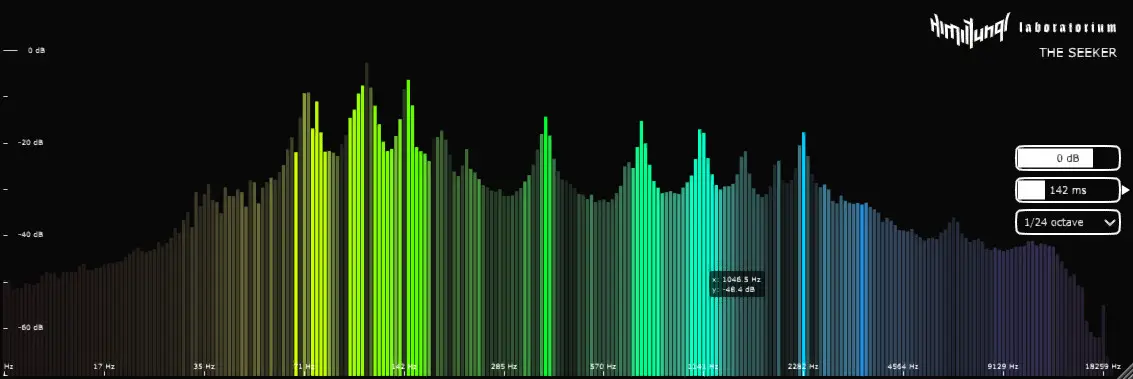
Analog-style Spectrum Analyzer
The Seeker brings you fast, dynamic spectrum analysis that will make your FFT-based analysers look like they’re frozen in time:
- Up to insane 1/192-octave spectrum resolution.
- 10 – 500 ms integration time to match different types of material.
- Eigen SSE-optimized core for low CPU-usage.
- Dual graph showing amplitude as well as dynamics simultaneously.
- Resizeable, minimal user interface.
New features in v1.1.0:
- Display graph axis values under cursor.
- Hide logo*.
- Hide settings*.
- Set spectrum scale level to adjust for low or high signals*.
* saved in presets.
{See video at top of page}
Compatibility:
- Requires OpenGL hardware support.
- Reportedly broken in Logic Pro X. Update: Please try v1.0.1 and see if it fixes the issue.
[Source code at github].
http://labs.himiltungl.com/

Spectrum Analyzer is a real-time spectrum analysis VST plugin. The idea was to create an old-fashioned tool reminiscent of classic hardware analyzers of the earlier centuries. Unlike most of other analyzers available these days, this plugin is not FFT-based but utilizes a filter-bank algorithms that mould its unique pros and cons.
Features:
- 1/3, 1/4 or 1/6 octave mode (30, 40 or 60 bands respectively).
- Simultaneous peak, peak-hold and average (RMS) display.
- Bar, Curve and Curve Fill modes.
- Entirely adjustable ballistics.
- Unrestrictedly resizable display window.
- Customizable colors.
- Supports any sample rate.
https://sevenphases.wordpress.com/
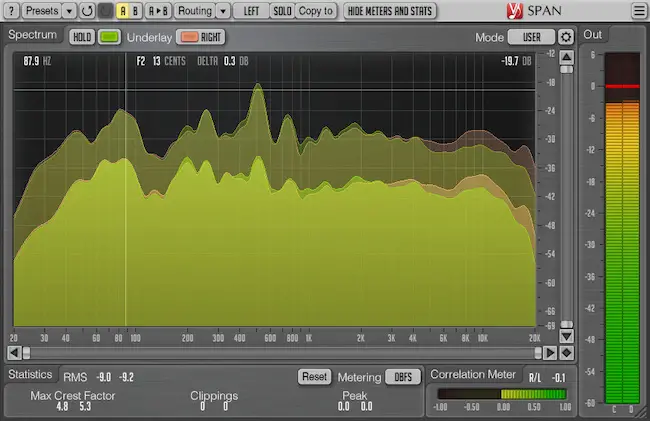
SPAN is a real-time “fast Fourier transform” audio spectrum analyzer plug-in for professional music and audio production applications. For the most part it was derived from Voxengo GlissEQ dynamic parametric equalizer and reproduces its spectrum analysis functionality.
Features & Compatibility:
- Output signal power statistics.
- K-metering.
- Internal channel routing.
- Undo/redo history.
- Clipping statistics.
- Multi-channel analysis.
- Channel grouping.
- A/B comparisons.
- Correlation meter.
- Mid/side analysis.
- Preset manager.
- Contextual hint messages.
https://www.voxengo.com/
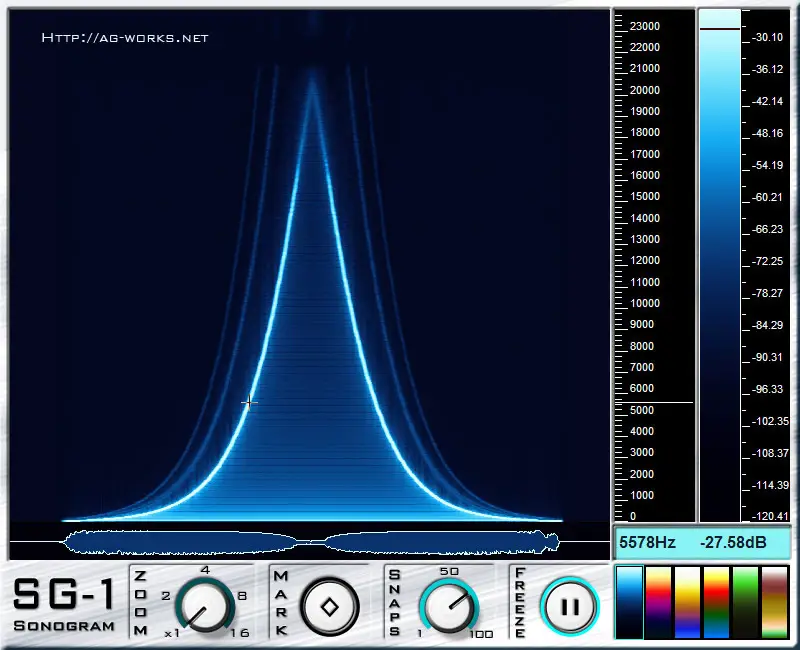
Sonogram SG-1is a real-time sonogram allowing for fast and detailed spectral analysis.
Sonogram SG-1 Features:
- Six scientific color palettes, each of them can highlight different dynamic ranges, from high power kick drum beats, to little spikes coming out from the noise floor.
- Snapshots-per-second control that can be changed on the fly, to increase or decrease the time resolution.
- At any time you can change the zoom ratio, without loosing frequency details for the signals which have already passed by.
- The zoomed screen can be scrolled while analyzing, to easily locate the frequency range of interest.
- Pause the visualization with the “freeze” control.
- Both in frozen or running mode, every time you click or drag within the sonogram area, frequency and amplitude rulers highlight the values corresponding to that point.
- Every palette can be shifted by simply dragging the dB ruler, to better contrast the right amplitude ranges.
- A mark button is provided to highlight interesting parts of the waveform for subsequent individuation.
- Every parameter supports host automation.
http://ag-works.net/

Sonic Visualiser is an application for viewing and analysing the contents of music audio files. The aim of Sonic Visualiser is to be the first program you reach for when want to study a musical recording rather than simply listen to it.
As well as a number of features designed to make exploring audio data as revealing as possible, Sonic Visualiser also has powerful annotation capabilities to help describe what you find, and the ability to run automated annotation and analysis plugins.
Features include sophisticated spectrogram views; multi-resolution waveform and data displays; manual annotation of time points and curves; measurement capabilities from spectrogram and spectrum; playback at any speed; looping and playback of discontiguous selections; ability to apply standard audio effects and compare the results with their inputs; and support for onset detection, beat tracking, structural segmentation, key estimation and many other automated feature extraction algorithms via Vamp audio analysis plugins.
Sonic Visualiser contains features for the following:
- Load audio files in WAV, Ogg and MP3 formats, and view their waveforms.
- Look at audio visualisations such as spectrogram views, with interactive adjustment of display parameters.
- Annotate audio data by adding labelled time points and defining segments, point values and curves.
- Overlay annotations on top of one another with aligned scales, and overlay annotations on top of waveform or spectrogram views.
- View the same data at multiple time resolutions simultaneously (for close-up and overview).
- Run feature-extraction plugins to calculate annotations automatically, using algorithms such as beat trackers, pitch detectors and so on.
- Import annotation layers from various text file formats.
- Import note data from MIDI files, view it alongside other frequency scales, and play it with the original audio.
- Play back the audio plus synthesised annotations, taking care to synchronise playback with display.
- Select areas of interest, optionally snapping to nearby feature locations, and audition individual and comparative selections in seamless loops.
- Time-stretch playback, slowing right down or speeding up to a tiny fraction or huge multiple of the original speed while retaining a synchronised display.
- Export audio regions and annotation layers to external files.
The design goals for Sonic Visualiser are:
- To provide the best available core waveform and spectrogram audio visualisations for use with substantial files of music audio data.
- To facilitate ready comparisons between different kinds of data, for example by making it easy to overlay one set of data on another, or display the same data in more than one way at the same time.
- To be straightforward. The user interface should be simpler to learn and to explain than the internal data structures. In this respect, Sonic Visualiser aims to resemble a consumer audio application.
- To be responsive, slick, and enjoyable. Even if you have to wait for your results to be calculated, you should be able to do something else with the audio data while you wait. Sonic Visualiser is pervasively multithreaded, loves multiprocessor and multicore systems, and can make good use of fast processors with plenty of memory.
- To handle large data sets. The work Sonic Visualiser does is intrinsically processor-hungry and (often) memory-hungry, but the aim is to allow you to work with long audio files on machines with modest CPU and memory where reasonable. (Disk space is another matter. Sonic Visualiser eats that.).
http://c4dm.eecs.qmul.ac.uk/